The ALLEXCEPT function is a beacon for those navigating the complex seas of data models, offering the unique ability to retain specific filters while removing all others from the context of a calculation.
Imagine effortlessly comparing sales performance across different regions while maintaining a consistent product category filter, or evaluating marketing campaign effectiveness by keeping the time periods intact but varying all other dimensions; this is the analytical prowess that ALLEXCEPT brings to the table.
In this blog, we’ll dive deep into the mechanics of the ALLEXCEPT function, unraveling its syntax and exploring its real-world applications.
What is Power BI?
Power BI is a suite of business analytics tools developed by Microsoft, designed for non-technical business users to aggregate, analyze, visualize and share data.
It includes a collection of software services, apps, and connectors that work together to turn unrelated sources of data into coherent, visually immersive, and interactive insights using a simple drag-and-drop interface with a robust set of capabilities.
What is the Allexcept Function in Power BI?
The `ALLEXCEPT` function in Power BI is a DAX formula used to clear all context filters from a table except the filters on specified columns. Essentially, it retains the filters on the columns you specify while removing all others, which is particularly useful when you need to perform calculations across a specific subset of data while ignoring filters on other attributes.
For instance, when calculating total sales across different regions while maintaining slicer selections on individual regions, `ALLEXCEPT` preserves the region context but disregards other page or report level filters, ensuring accurate and context-relevant data aggregation within visuals.
How to Use the Allexcept Function in Power BI
The `ALLEXCEPT` function in Power BI is a potent DAX tool, instrumental for granular data analysis within visuals. It meticulously strips away all filters from a dataset, save for those explicitly specified, facilitating intricate aggregations while preserving selected dimensional granularity, essential for precise, context-aware insights.
Step 1: Set up a Data Model
Before using the ALLEXCEPT function, you need a data model in Power BI with at least one table that has relationships with other tables, if necessary, to demonstrate the effect of the function in context.
- Import Data: In Power BI Desktop, import the data you want to analyze. This can be done from various sources such as Excel, SQL Server, web, etc.
- Create Relationships: If you have multiple tables, go to the Model view and establish relationships between these tables by dragging a line between the related fields (primary and foreign keys).
- Ensure Correct Relationship: Make sure that the relationships are correctly set up (one-to-one, one-to-many, etc.), and that the cardinality and cross-filter direction are appropriate for your analysis.
- Review Fields: Check the fields on which you will want to maintain filters (the exceptions) when using the ALLEXCEPT function later. These fields must be part of the table you’re applying the function to.
Step 2: Use ALLEXCEPT in a Measure or Calculated Column
Once your data model is set up, you can create a measure or calculated column using the ALLEXCEPT function.
- Create a New Measure: Go to the Fields pane, right-click on a table, and select ‘New measure’.
- Enter DAX Expression: In the formula bar, start typing your DAX formula using ALLEXCEPT. For example: Sales AllExcept = CALCULATE(SUM(Transactions[Amount]), ALLEXCEPT(Transactions, Transactions[Country], Transactions[Year]))
In this example, Transactions[Amount] is the column containing the values to sum, and Transactions[Country] and Transactions[Year] are the columns for which filters should remain applied.
- Check Your Measure: After creating the measure, you can add it to a visual and check if it is behaving as expected by slicing the data by different fields and seeing the measure’s behavior.
Power BI Intermediate Functions: Exploring Allexcept for Enhanced Data Analysis
By selectively preserving specific column filters while removing others, it facilitates comparative and exception-based analyses, a vital technique for intermediate users seeking refined insights within their data models.
Calculate Function
The CALCULATE function in Power BI is a cornerstone of DAX (Data Analysis Expressions) language, offering the capability to perform dynamic aggregations and context modifications across data models.
Here is how CALCULATE works:
Syntax: CALCULATE(<expression>, <filter1>, <filter2>, …)
- <expression> is the calculation you want to perform, typically an aggregation like SUM, AVERAGE, or COUNT.
- <filter1>, <filter2>, … are the filter arguments that redefine the context in which the calculation is performed. These can be in the form of filter expressions, table expressions, or functions like FILTER, ALL, ALLEXCEPT, and others.
CALCULATE is incredibly powerful for scenarios where the default context of the data needs to be transformed for specific calculations, providing analysts with both flexibility and control in their reporting.
Argument List and Subsequent Arguments
In the realm of Power BI’s DAX functions, ALLEXCEPT stands out for its utility in maintaining a specified column filter while clearing all other context filters. This is particularly useful when comparing specific slices of data against more general data aggregates.
Argument Structure of ALLEXCEPT: ALLEXCEPT(Table, [Column1], [Column2], …, [ColumnN])
- Table: The table you want to remove filters from.
- [Column1], [Column2], …, [ColumnN]: The columns you want to retain filters on.
The use of ALLEXCEPT in this way allows for complex and flexible analysis in Power BI reports, such as comparing sales performance across different countries without being influenced by the report’s other filters.
Filter Contexts and Context Filters
In Power BI, understanding the concept of context is crucial for data analysis, particularly when using DAX (Data Analysis Expressions). There are two main types of contexts: Row Context and Filter Context. When working with DAX functions such as ALLEXCEPT, the focus is primarily on the Filter Context.
Using ALLEXCEPT to Control Filter Context:
ALLEXCEPT is used within a DAX formula to modify the current filter context by clearing all context filters except those specified for particular columns.
Example:
Let’s say you have a visual that shows total sales, and you have applied a slicer for ‘Year’ and ‘Country’. Normally, the visual will show sales for the selected ‘Year’ and ‘Country’. If you create a measure using ALLEXCEPT:
Total Sales ALLEXCEPT Country = CALCULATE (
SUM(Sales[TotalSales]),
ALLEXCEPT(Sales, Sales[Country])
)
This measure will calculate the sum of the TotalSales column while keeping the filter context on the Country column intact and removing all other filters, including the one for ‘Year’. This is particularly useful for analysis where you need to compare sales across all years but within specific countries.
ALLSELECTED DAX Filter Function
The ALLSELECTED function in DAX (Data Analysis Expressions) is another important function that interacts with the filter context in Power BI, and it’s often confused with ALLEXCEPT. However, it serves a different purpose and is used in different scenarios.
Understanding ALLSELECTED:
ALLSELECTED can be used for advanced calculations that respect the user’s current filter selections, even after other filters might have been applied in a report or during a calculation with CALCULATE.
It returns all the rows in a table, or all the values in a column, that were visible at the time the query started execution, considering all the filters that were applied by the user through the UI (slicers, visual-level, page-level, or report-level filters).
Syntax: ALLSELECTED([TableOrColumn])
- [TableOrColumn]: (Optional) The table or column from which to remove filters. If not specified, ALLSELECTED operates on all columns in the current context.
In this DAX formula, the ALLSELECTED function without any arguments will maintain all the filters that the user has applied through slicers or other filter UI elements before the CALCULATE function is applied.

Simplifying Data Visualization with Basic Filters in Power BI allexcept
Harnessing `ALLEXCEPT` in Power BI equips analysts with the precision to simplify visualizations by maintaining focused filter conditions on chosen dimensions, while disregarding extraneous context.
Table Expressions and Column Expressions
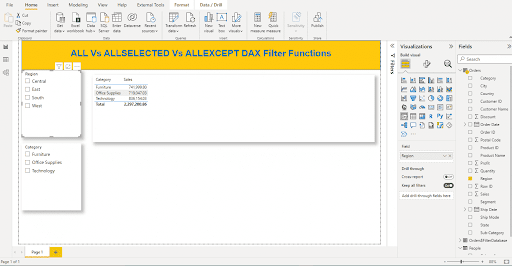
Imagine you have a sales data table (SalesData) with columns for Region, Category, Product, and SalesAmount.
Now, let’s say you want to calculate the total sales for a specific category, regardless of the product but still respecting the filters on the Region. You could create a measure like this: TotalSales_AllProductsInRegion =
CALCULATE(
SUM(SalesData[SalesAmount]),
ALLEXCEPT(SalesData, SalesData[Region])
)
This measure sums up the SalesAmount while removing any filters that may have been applied to the Product column. However, it respects any filters applied to the Region column. This is useful if you want to see the total sales per region for all categories and products without removing slicers or filters that are applied to the Region.
Clearing Filters
The DAX function ALLEXCEPT is particularly useful for clearing filters selectively. It retains filters on specified columns while removing them from all other columns in the context of a calculation.
Here’s a step-by-step approach to simplifying data visualization by clearing filters with ALLEXCEPT:
Step 1: Understand Your Data Model
Step 2: Identify Where Filters Need to Be Cleared
Step 3: Create Measures with ALLEXCEPT
Here’s an example measure that calculates total sales, clearing all filters except for the ones on the Region column:
Total Sales by Region =
CALCULATE(
SUM(‘Sales'[SalesAmount]),
ALLEXCEPT(‘Sales’, ‘Sales'[Region])
)
Step 4: Add Visuals to Your Report
Step 5: Test the Measure with Slicers
Step 6: Verify the Calculation Behavior
Step 7: Simplify Your Visualizations
Step 8: Explain the Data to Your Audience
By following these steps and using ALLEXCEPT judiciously, you can create powerful and simplified visualizations that provide valuable insights without being overshadowed by unnecessary filter complexity.
Removal of Filters
This function is part of the Power BI formula language that enables you to remove all context filters in the data model except for the filters applied to specific columns.
Here’s a brief guide on how to remove filters using ALLEXCEPT:
Step 1: Use ALLEXCEPT in a Measure
Here’s the syntax for the ALLEXCEPT function:
MeasureName = CALCULATE (
[Aggregation Function],
ALLEXCEPT ( TableName, TableName[ColumnNameToKeepFiltersOn], … )
)
Step 2: Apply the Measure to Visuals
Step 3: Add Slicers (Optional)
Step 4: Verify Correct Behavior
Example
Suppose you have a Sales table with Region, Date, and SalesAmount columns, and you want to calculate the total sales while ignoring any filters set on the Date:
Total Sales Ignoring Date Filter = CALCULATE (
SUM(Sales[SalesAmount]),
ALLEXCEPT(Sales, Sales[Region])
)
This measure will always return the total sales for each region regardless of any filters applied to the Date column, but it will respect the filters on the Region column.
Transform Your Business with EPC Group’s Power BI Predictive Analytics Consulting
In conclusion, the EPC Group’s Power BI Predictive Analytics Consulting stands as your ideal partner in harnessing the full potential of functions like ALLEXCEPT for sophisticated data analysis. By engaging with our expert consultants, your business can effectively utilize Power BI to not only visualize complex datasets but also to anticipate future trends and outcomes.
We understand that the backbone of robust predictive analytics lies in a meticulous understanding of your unique business landscape. Our consultants architect bespoke models that not only integrate seamlessly with your existing infrastructure but also scale with your aspirations.
Partner with EPC Group and let us infuse your business with the predictive intelligence that drives growth, fosters resilience, and creates a sustainable competitive edge.