Power BI, a popular business intelligence tool, has revolutionized how organizations analyze and interpret data. Interestingly, a recent survey has revealed that companies that invest in data analytics have a much higher chance of gaining new customers, 23 times to be precise. Not only that, these companies are also 19 times more likely to make greater profits.
For those looking to gain deeper insights from their data, the RANKX function in Power BI is a powerful tool that can help rank and analyze data effectively. In this article, we’ll explore everything you need to know about the RANKX function in Power BI and how it can help your organization make informed business decisions.
What is RANKX Power BI?
RANKX is a DAX (Data Analysis Expressions) function in Power BI that allows you to rank data based on a specified measure or column. It is a versatile function that can be used to solve a variety of ranking-related problems, such as finding the top-selling products and identifying the highest-performing salespeople or ranking customers based on their profitability.

Understanding Power BI’s RANKX
The RANKX function in Power BI works by assigning a unique rank to each row in a table based on the specified measure or column. The rank is determined by comparing the values of the measure or column for each row with those of other rows in the same table. The result is a dynamic ranking that can be adjusted based on different filters or slicers applied to the data.
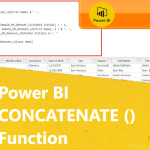
RANKX Dax Definition and Syntax
To utilize the RANKX function in Power BI, you need to understand its syntax and parameters. The syntax of the RANKX function is as follows:
RANKX(<table>, <expression>[, <value>[, <order>[, <ties>]]])
- Table: The table or table expression that contains the data you want to rank.
- Expression: The measure or column by which you want to rank the data.
- Value: The specific value for which you want to calculate the rank. This parameter is useful when you want to find the rank of a particular value within the dataset.
- Order: The order in which you want to rank the data. Accepted values are 0 (ascending) or 1 (descending).
- Ties: Specifies how to handle tied values. Accepted values are 0 (average rank) or 1 (min rank).
Parameters of RANKX Function
Let’s go deeper into the parameters of the RANKX function:
- Table: This parameter refers to the table or table expression that contains the data you want to rank. It can be a physical table in your dataset or a calculated table derived from a query.
- Expression: This parameter represents the measure or column you want to use for ranking. It can be any valid DAX expression that evaluates to a numeric value.
- Value: This optional parameter allows you to specify a specific value for which you want to calculate the rank. It is useful when you want to find the rank of a particular value within the dataset.
- Order: This optional parameter determines the order in which the data will be ranked. You can choose ascending (0) or descending (1) order.
- Ties: This optional parameter defines how to handle tied values. You can opt for an average rank (0) or a minimum rank (1) for tied values.
Exploring the Execution of the RANKX
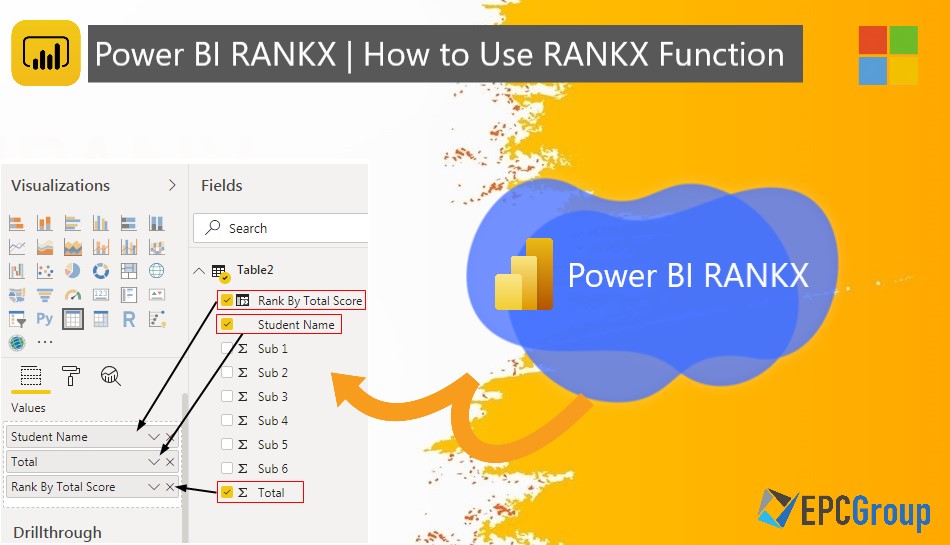
Now, let’s walk through a step-by-step guide to implementing the RANKX DAX function in Power BI.
- Open Power BI Desktop and load your data into the model.
- Create a new measure or use an existing one to serve as the basis for ranking.
- Write the RANKX function, specifying the table and the measure to rank.
- Provide any optional parameters you want to include.
- Drag the relevant fields onto a visual, such as a table or a chart, to display the ranking.
Practical RANKX Examples
To truly understand how to use the RANKX function, let’s explore some practical examples:
- Ranking Products by Sales: Use RANKX to determine the top-selling products based on sales. This can help identify which products are generating the most revenue.
- Ranking Customers by Profitability: Apply RANKX to rank customers based on profitability. This can assist in focusing on high-value customers and tailoring marketing strategies accordingly.
- Ranking Salespeople by Performance: Utilize RANKX to rank salespeople based on their performance metrics. This can help identify the top performers and incentivize others to improve.
- Ranking Projects by Complexity: Use RANKX to rank projects based on their complexity level. This can help project managers prioritize resource allocation and anticipate risks.
Tips for Utilizing RANKX Effectively in Power BI
To make the most out of the RANKX function in Power BI, consider these tips:
- Understand the Data Model: Get a clear understanding of the relationships between tables and how they impact the RANKX calculations.
- Define Proper Measures: Ensure you have well-defined measures that accurately reflect the data you want to rank.
- Test Different Parameters: Experiment with different parameters, such as order and ties, to see how they affect the ranking results.
- Use Visualization Techniques: Visualize the rankings using appropriate visuals, such as a bar chart or a table, to interpret the results easily.
EPC Group Expertise in Power BI Services
With this complete guide to the RANKX DAX function in Power BI, you now have the knowledge to rank and analyze your data effectively. You can utilize the RANKX function to find valuable insights and make data-driven decisions. If you need assistance with Power BI implementation or any other Microsoft services, EPC Group is here to help.
As a Microsoft Gold Partner, EPC Group has a proven track record of providing innovative solutions and expert support. Visit our official website to learn more about our Power BI services and how we can help your business succeed.